
DoorDash / Retail & delivery marketplace
More repeat orders.
A better customer experience.
Turning transaction data into recommendations for sales growth, delivery performance and customer loyalty.
The situation
Find the growth.
Understand the friction.
The DoorDash brief was to identify opportunities to optimise sales and customer experience through data analytics. For a delivery marketplace, repeat purchases depend on consumers, restaurants and drivers working together.
I analysed one month of transaction data to connect customer ordering patterns, regional and restaurant performance, delivery timing and refunds. My recommendations focused on targeted promotions, restaurant partnerships, peak-period driver coverage and investigation of service issues.
- Business
- DoorDash
- Context
- Strategy and operations analytics
- My contribution
- Data analysis, commercial insights and recommendations
- Evidence
- One month of data; six original analysis slides
Explore the original work. The analysis and recommendation slides are shown below. Select a slide to enlarge it, then choose “Fit slide to page” to return.
01 / The complexity
One marketplace. Three connected experiences.
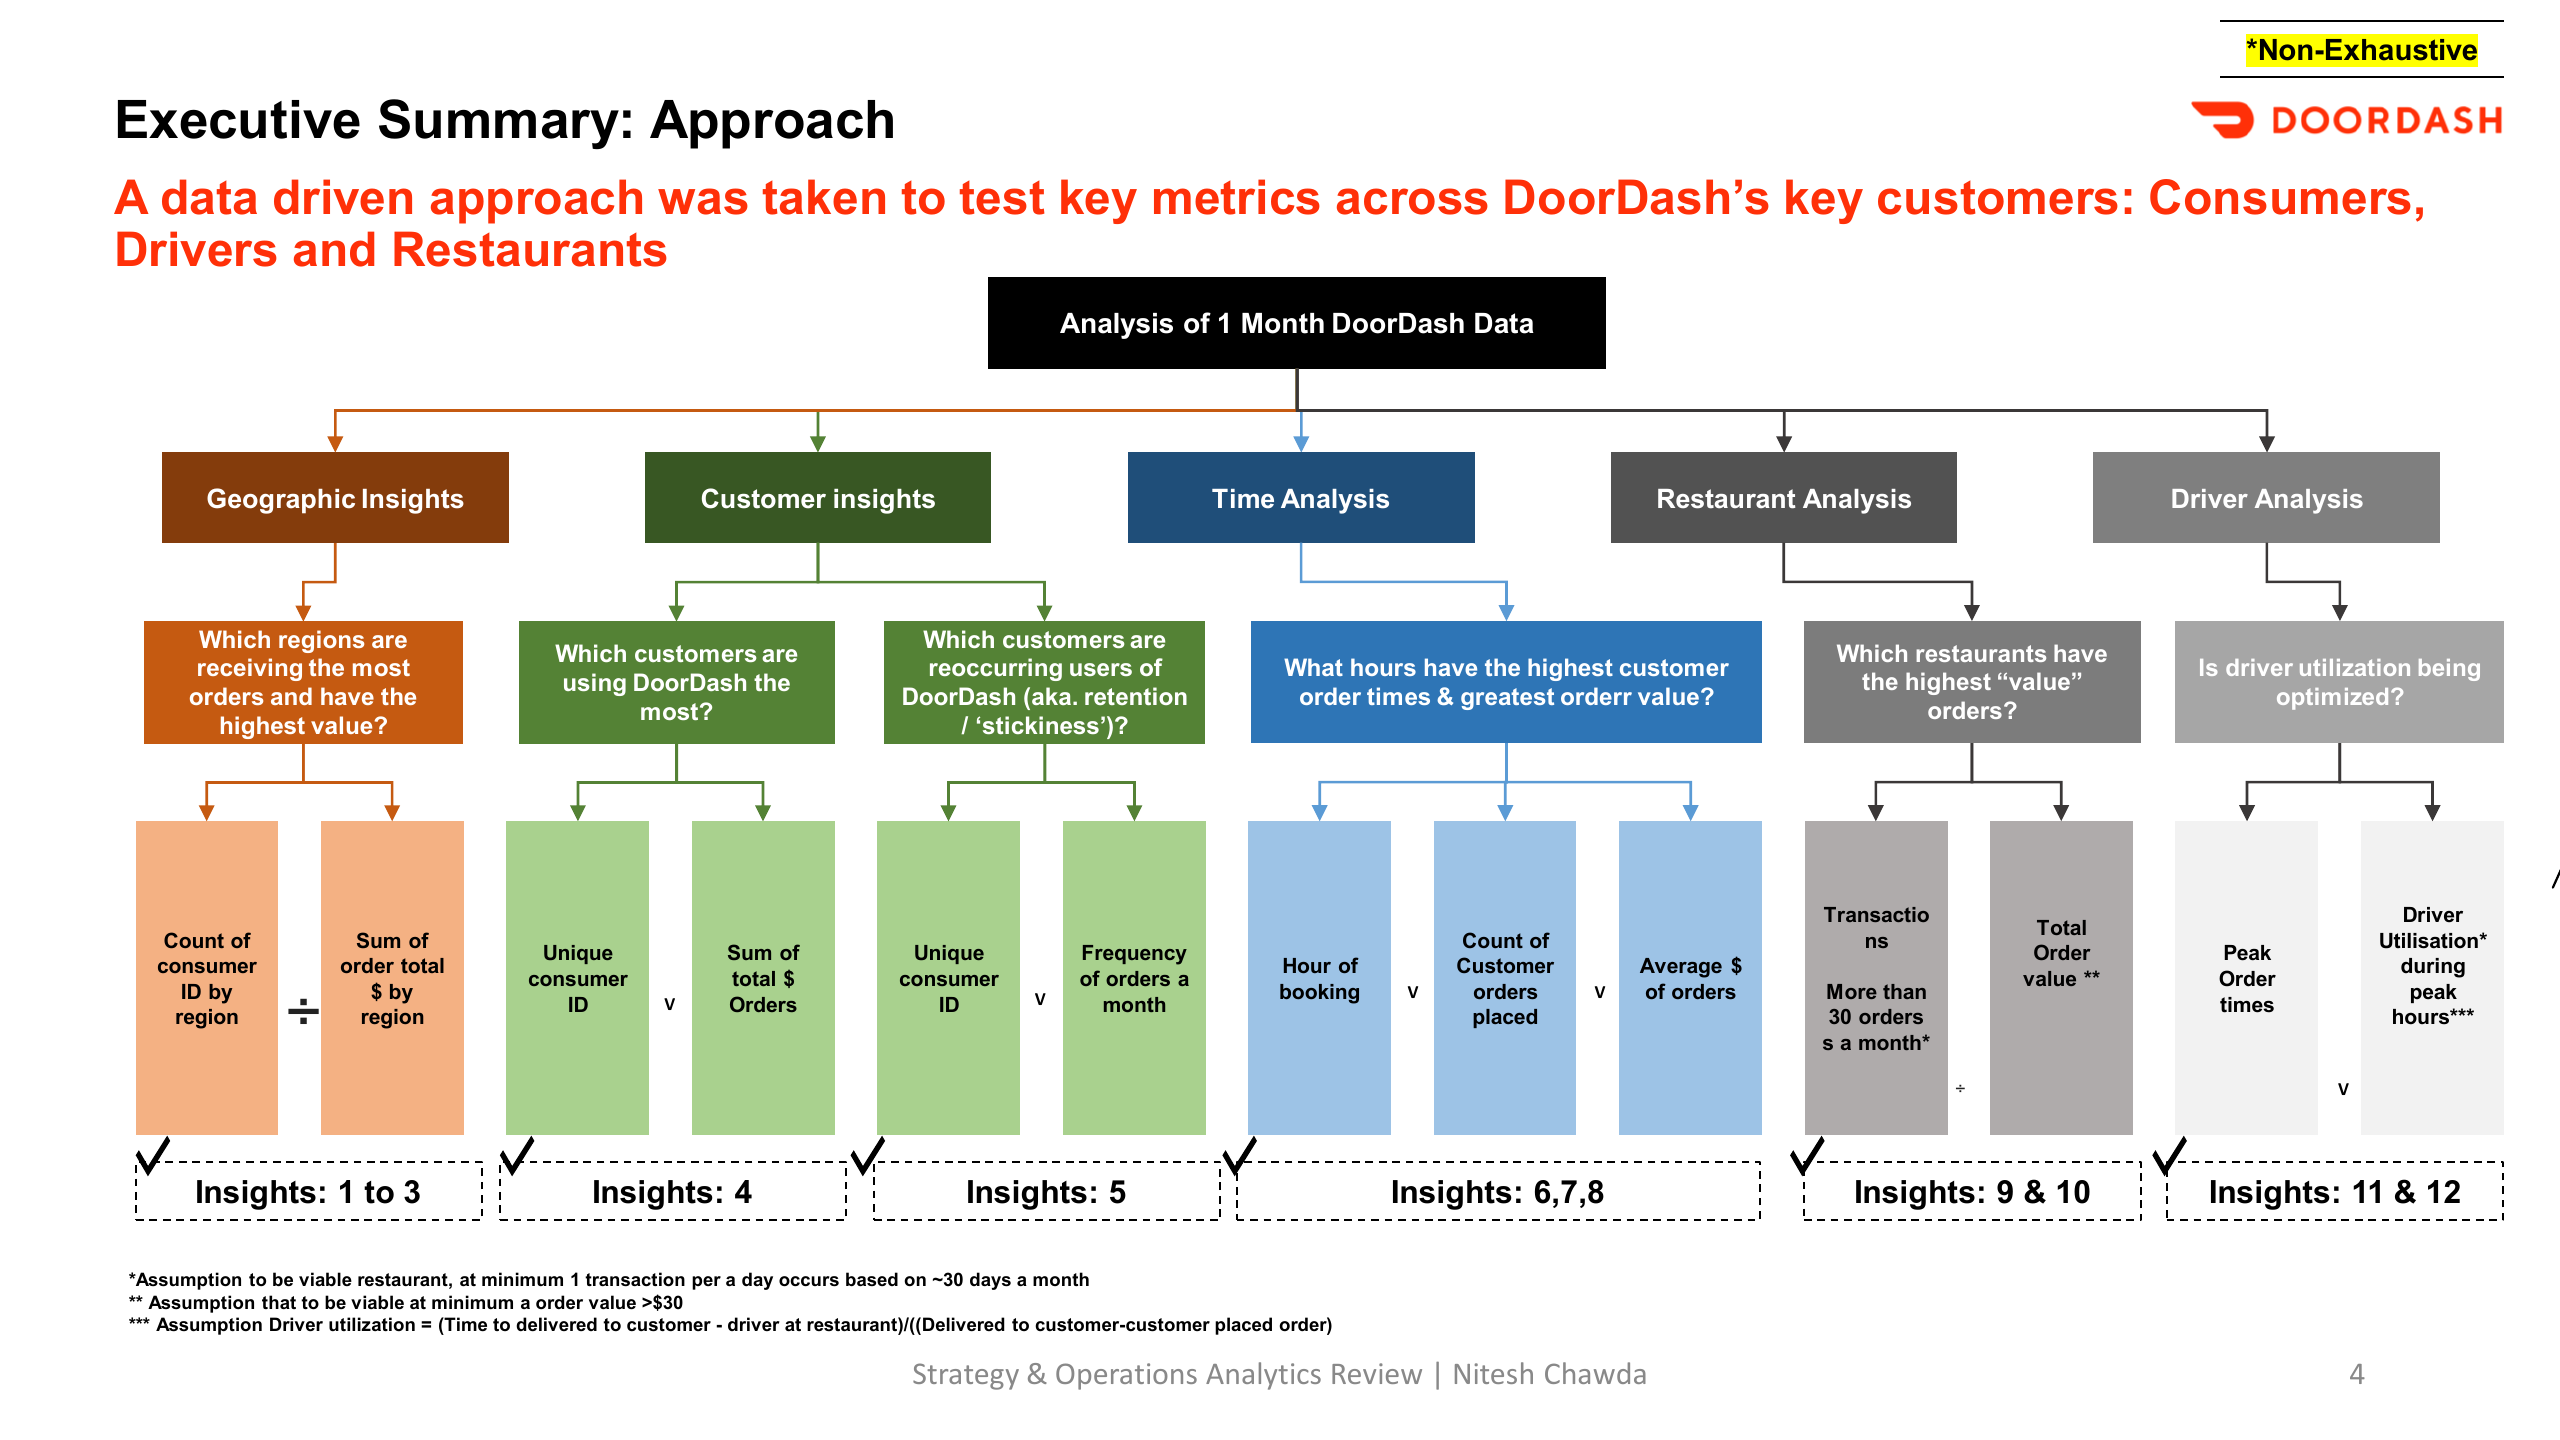
Order volume alone could not explain where to invest. I needed to connect how frequently consumers ordered, which restaurants generated value and how delivery performance affected the experience. Missing region labels and a short observation window also required care in interpreting the findings.
Repeat demand
Who orders, how often, at what value and at which times?
Commercial mix
Where do transaction values and order frequency suggest partnership opportunities?
Service delivery
How do delivery timing and refunds point to issues worth investigating?
View original slide: Analytical approach
02 / The answer: sales
Target the next order.
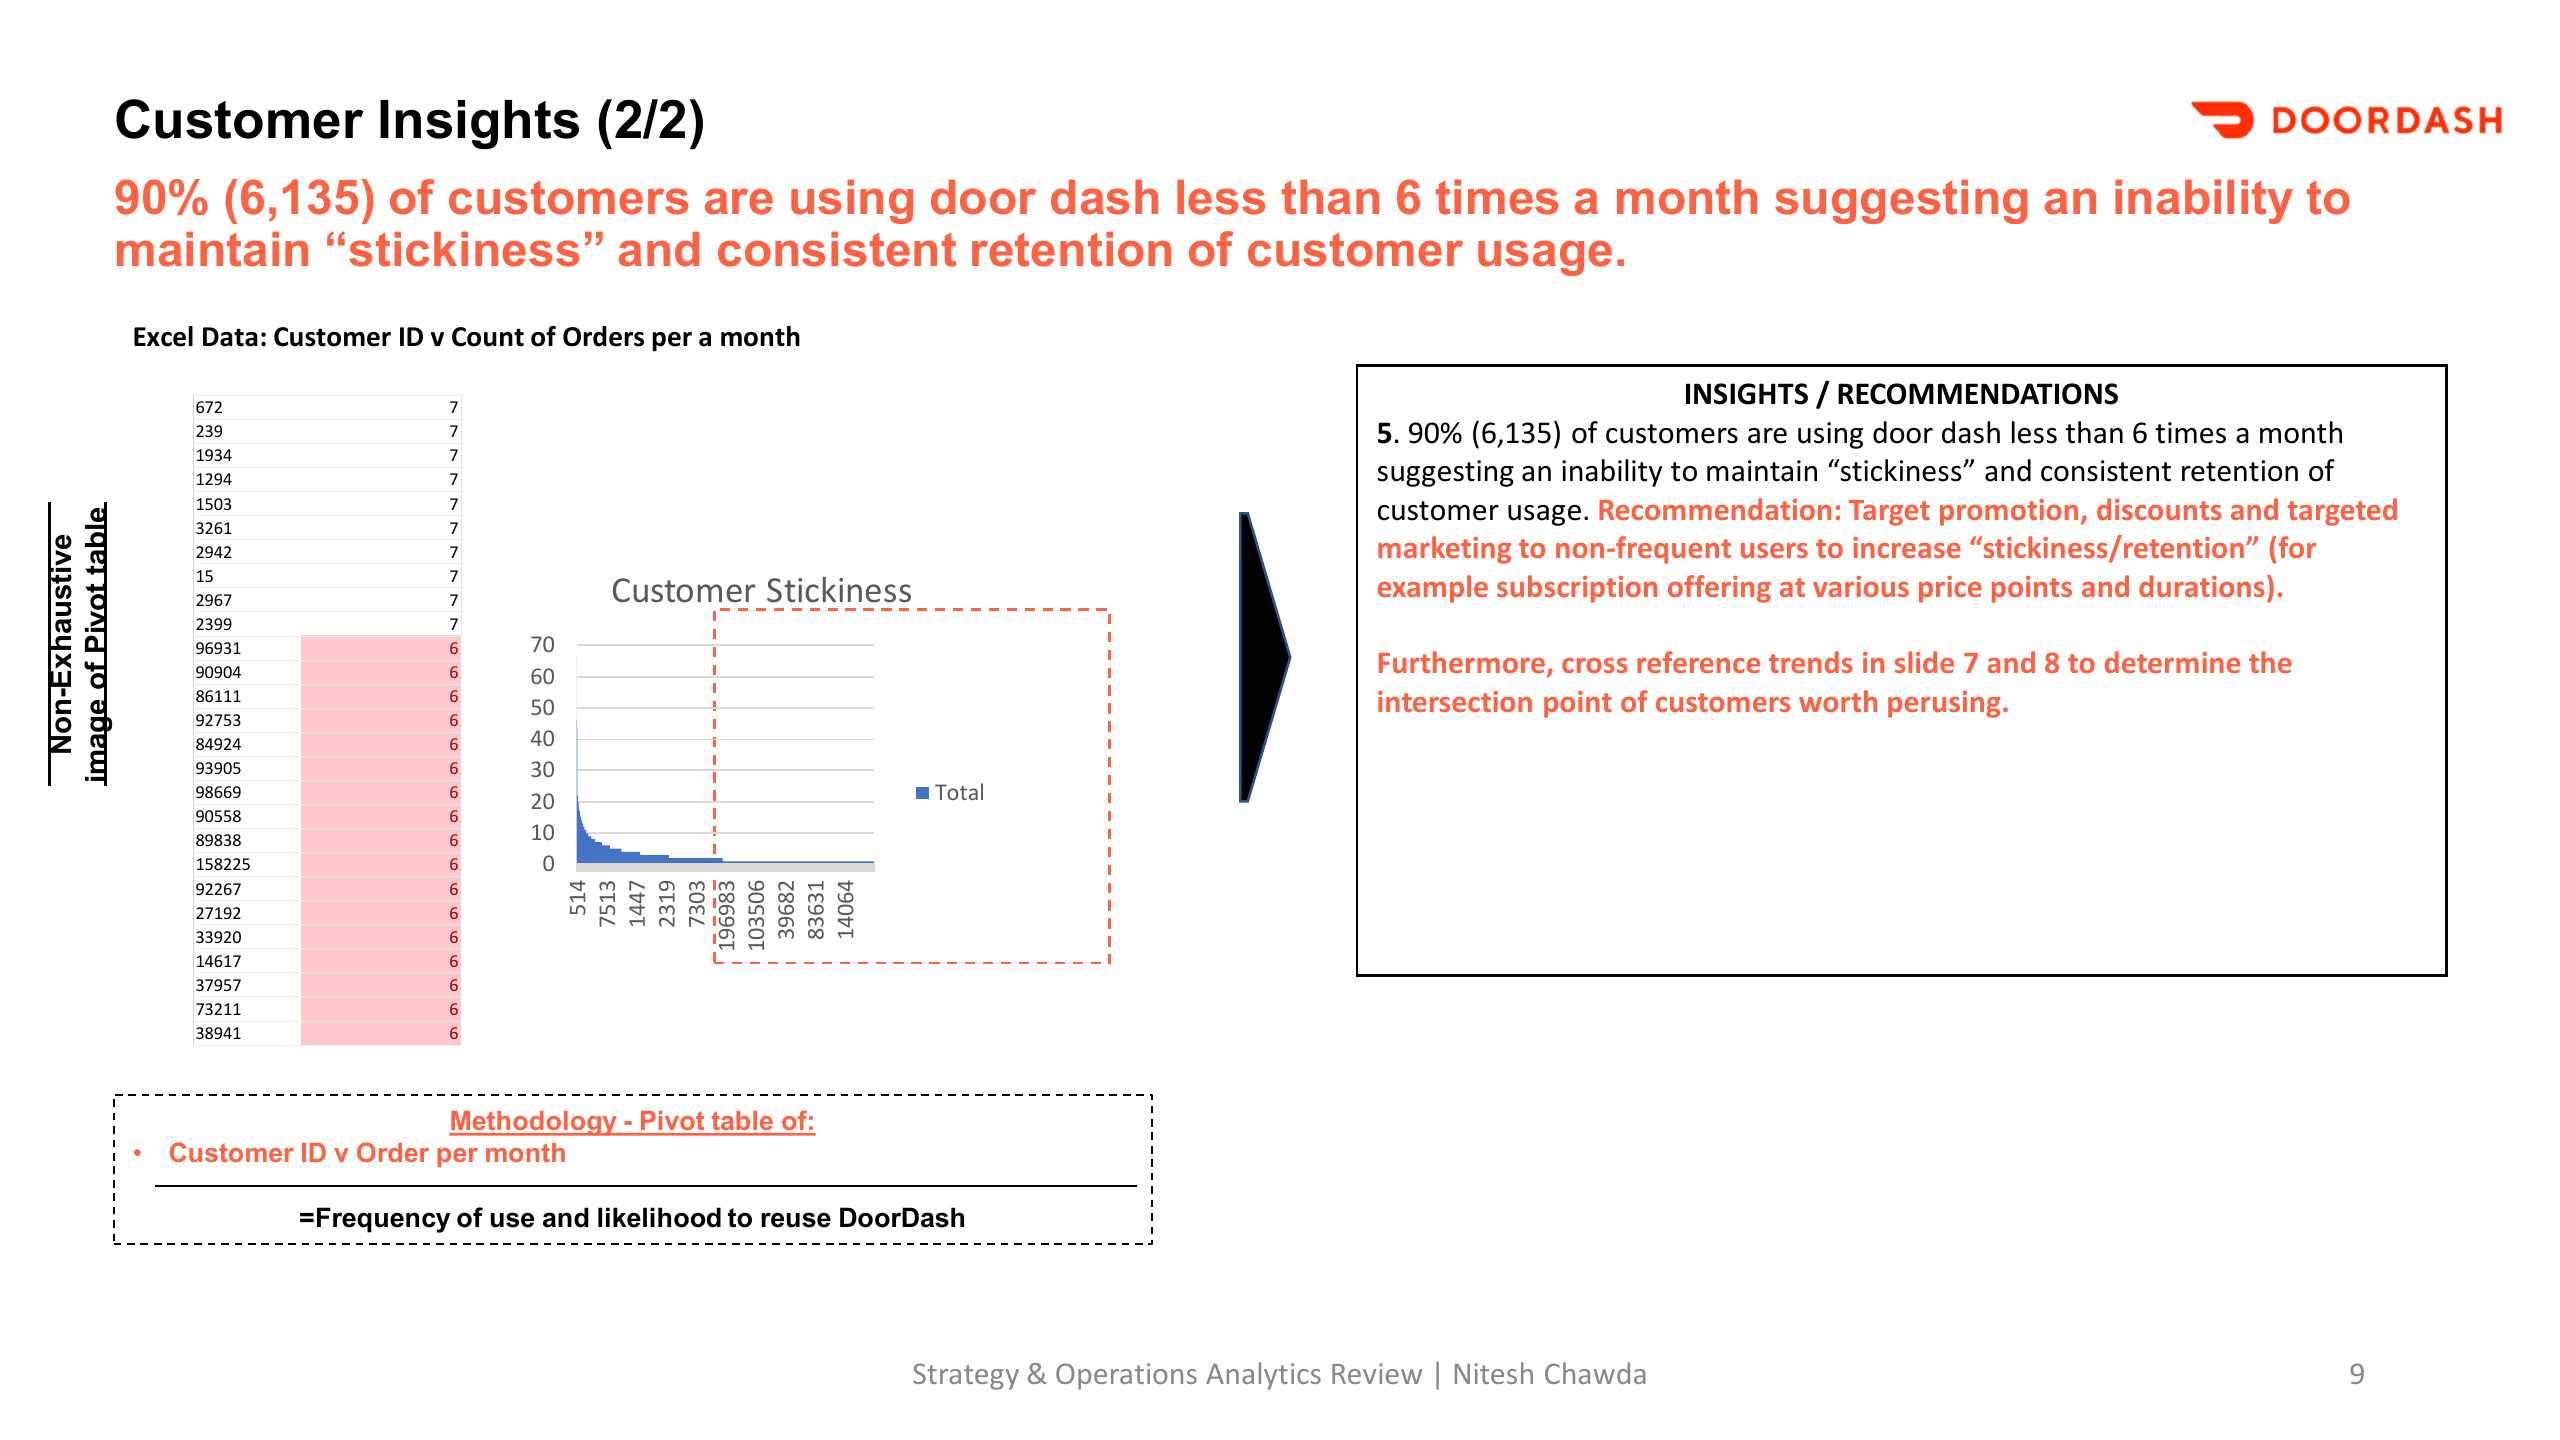
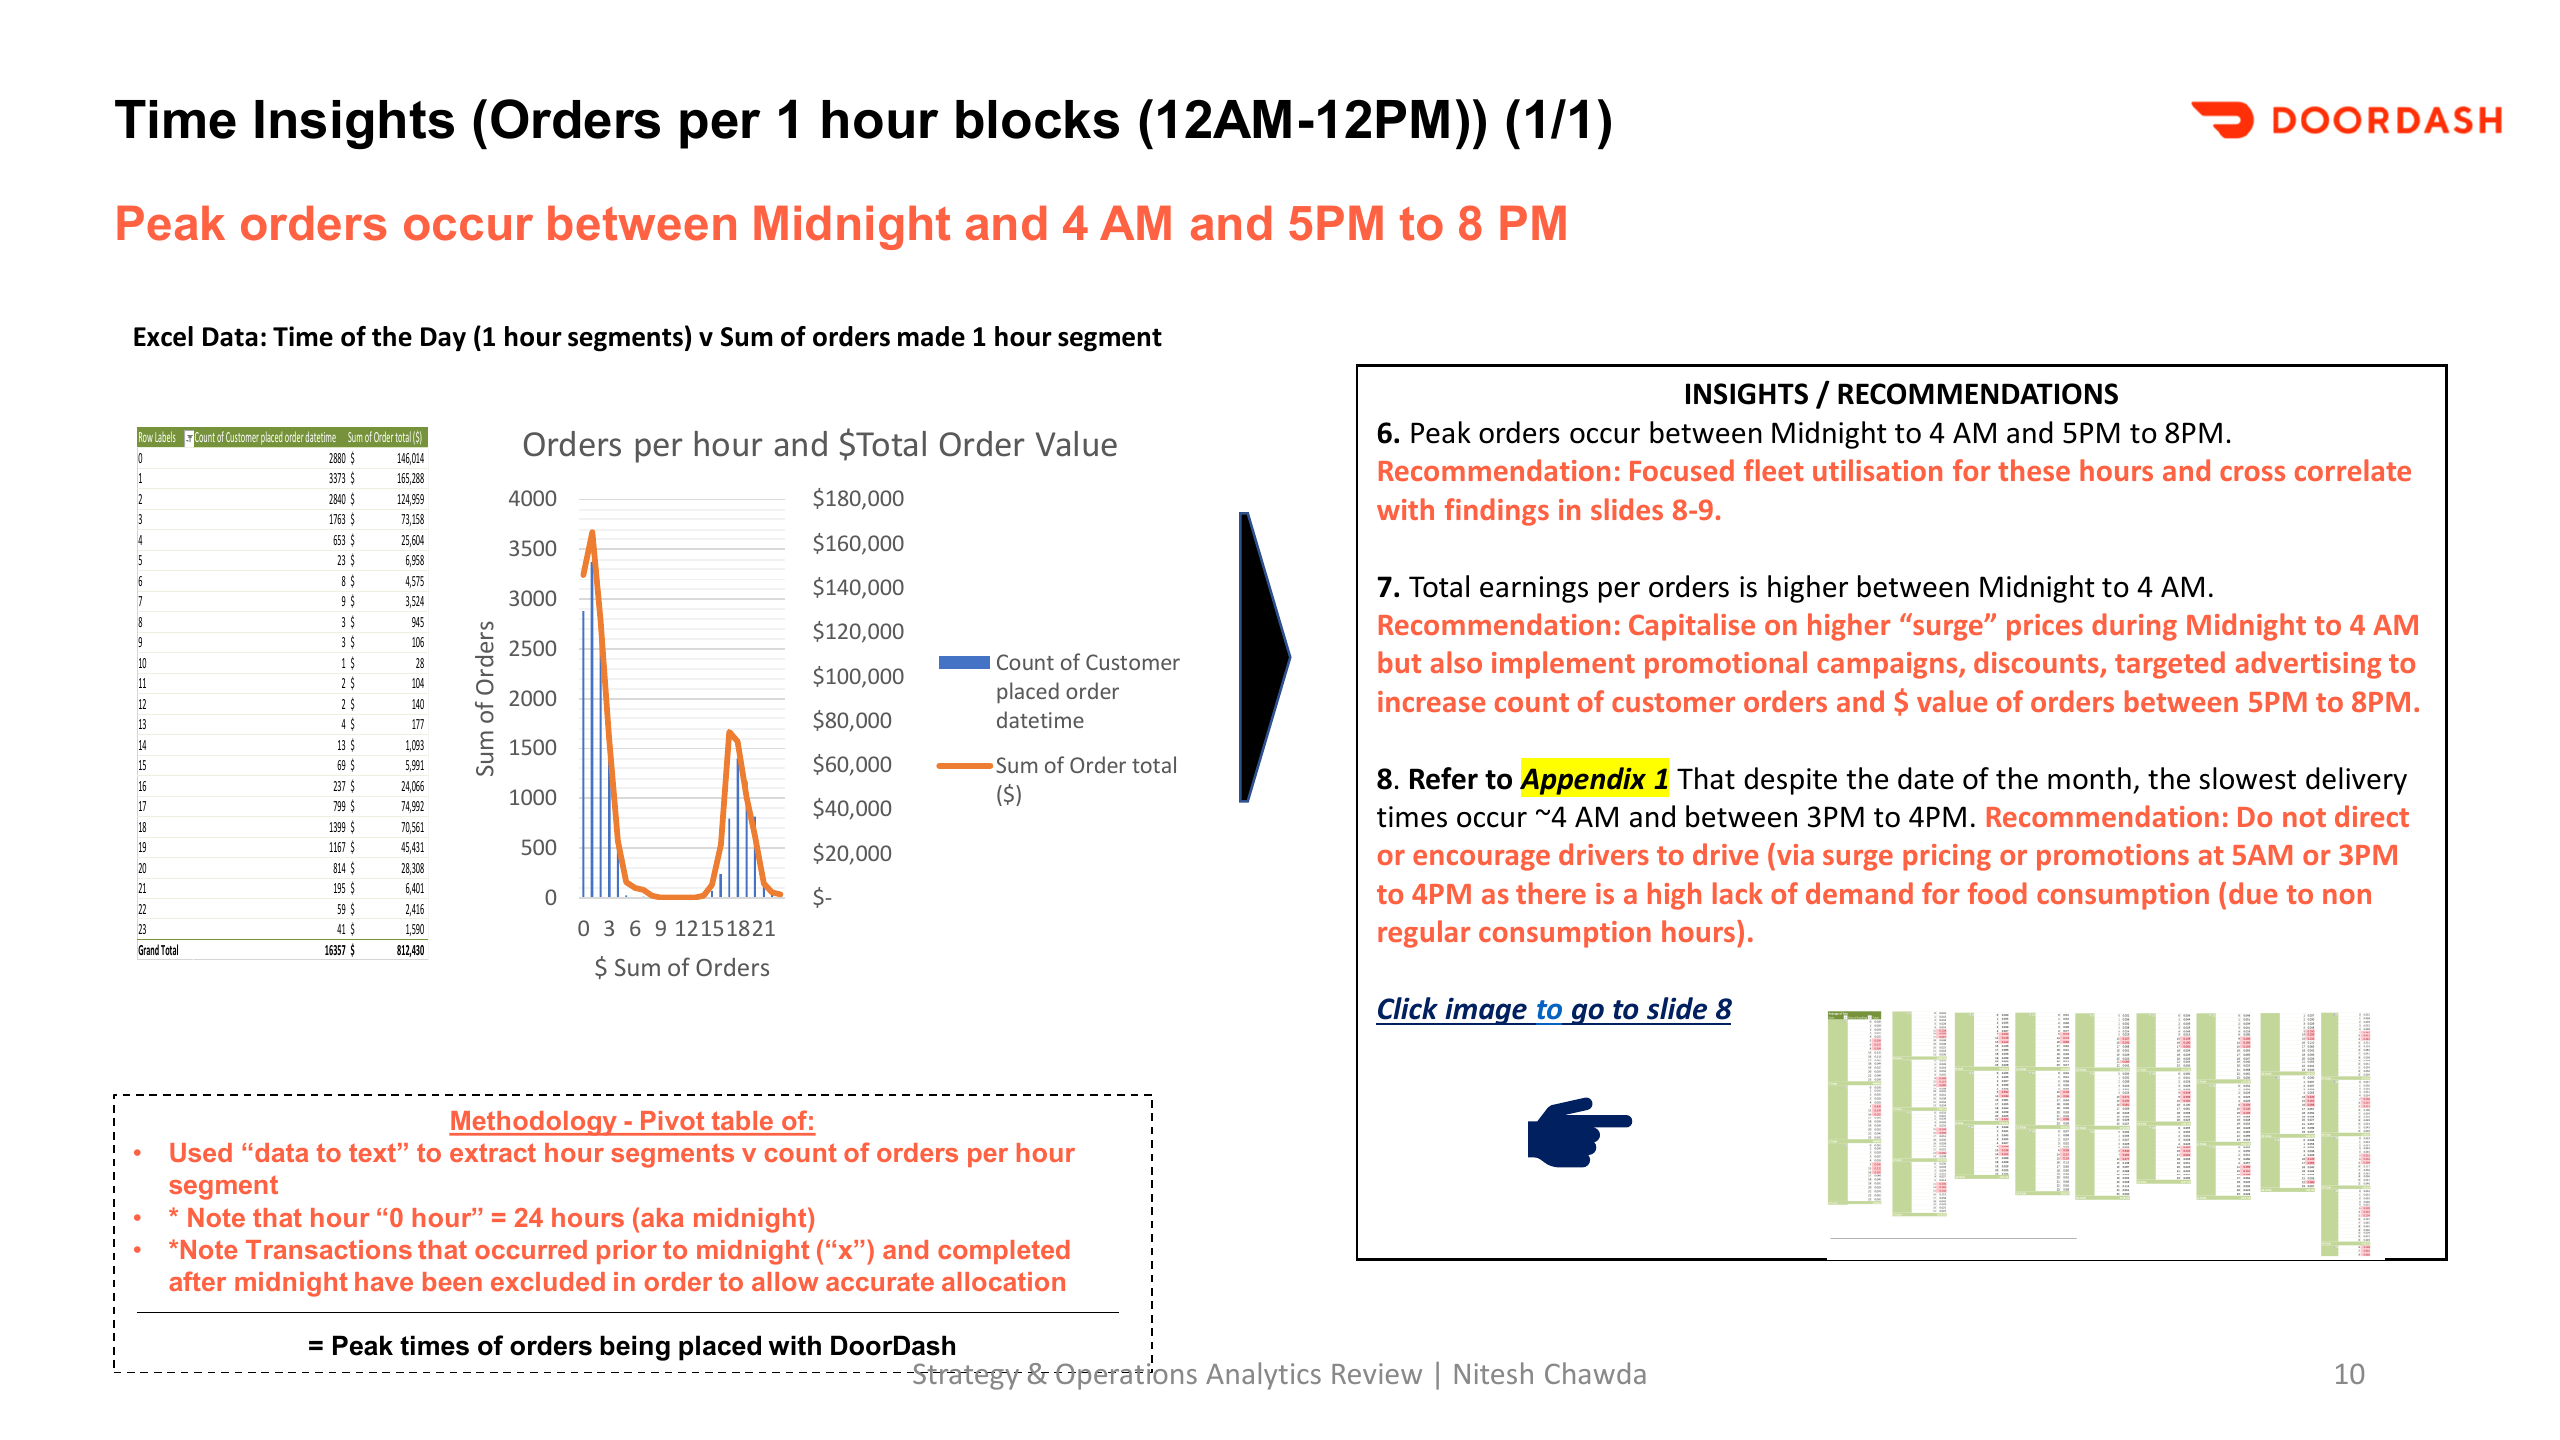
The customer analysis showed a long tail of infrequent purchasers. I recommended targeted promotions and subscription options to encourage repeat orders, supported by restaurant partnerships and a closer look at demand by hour.
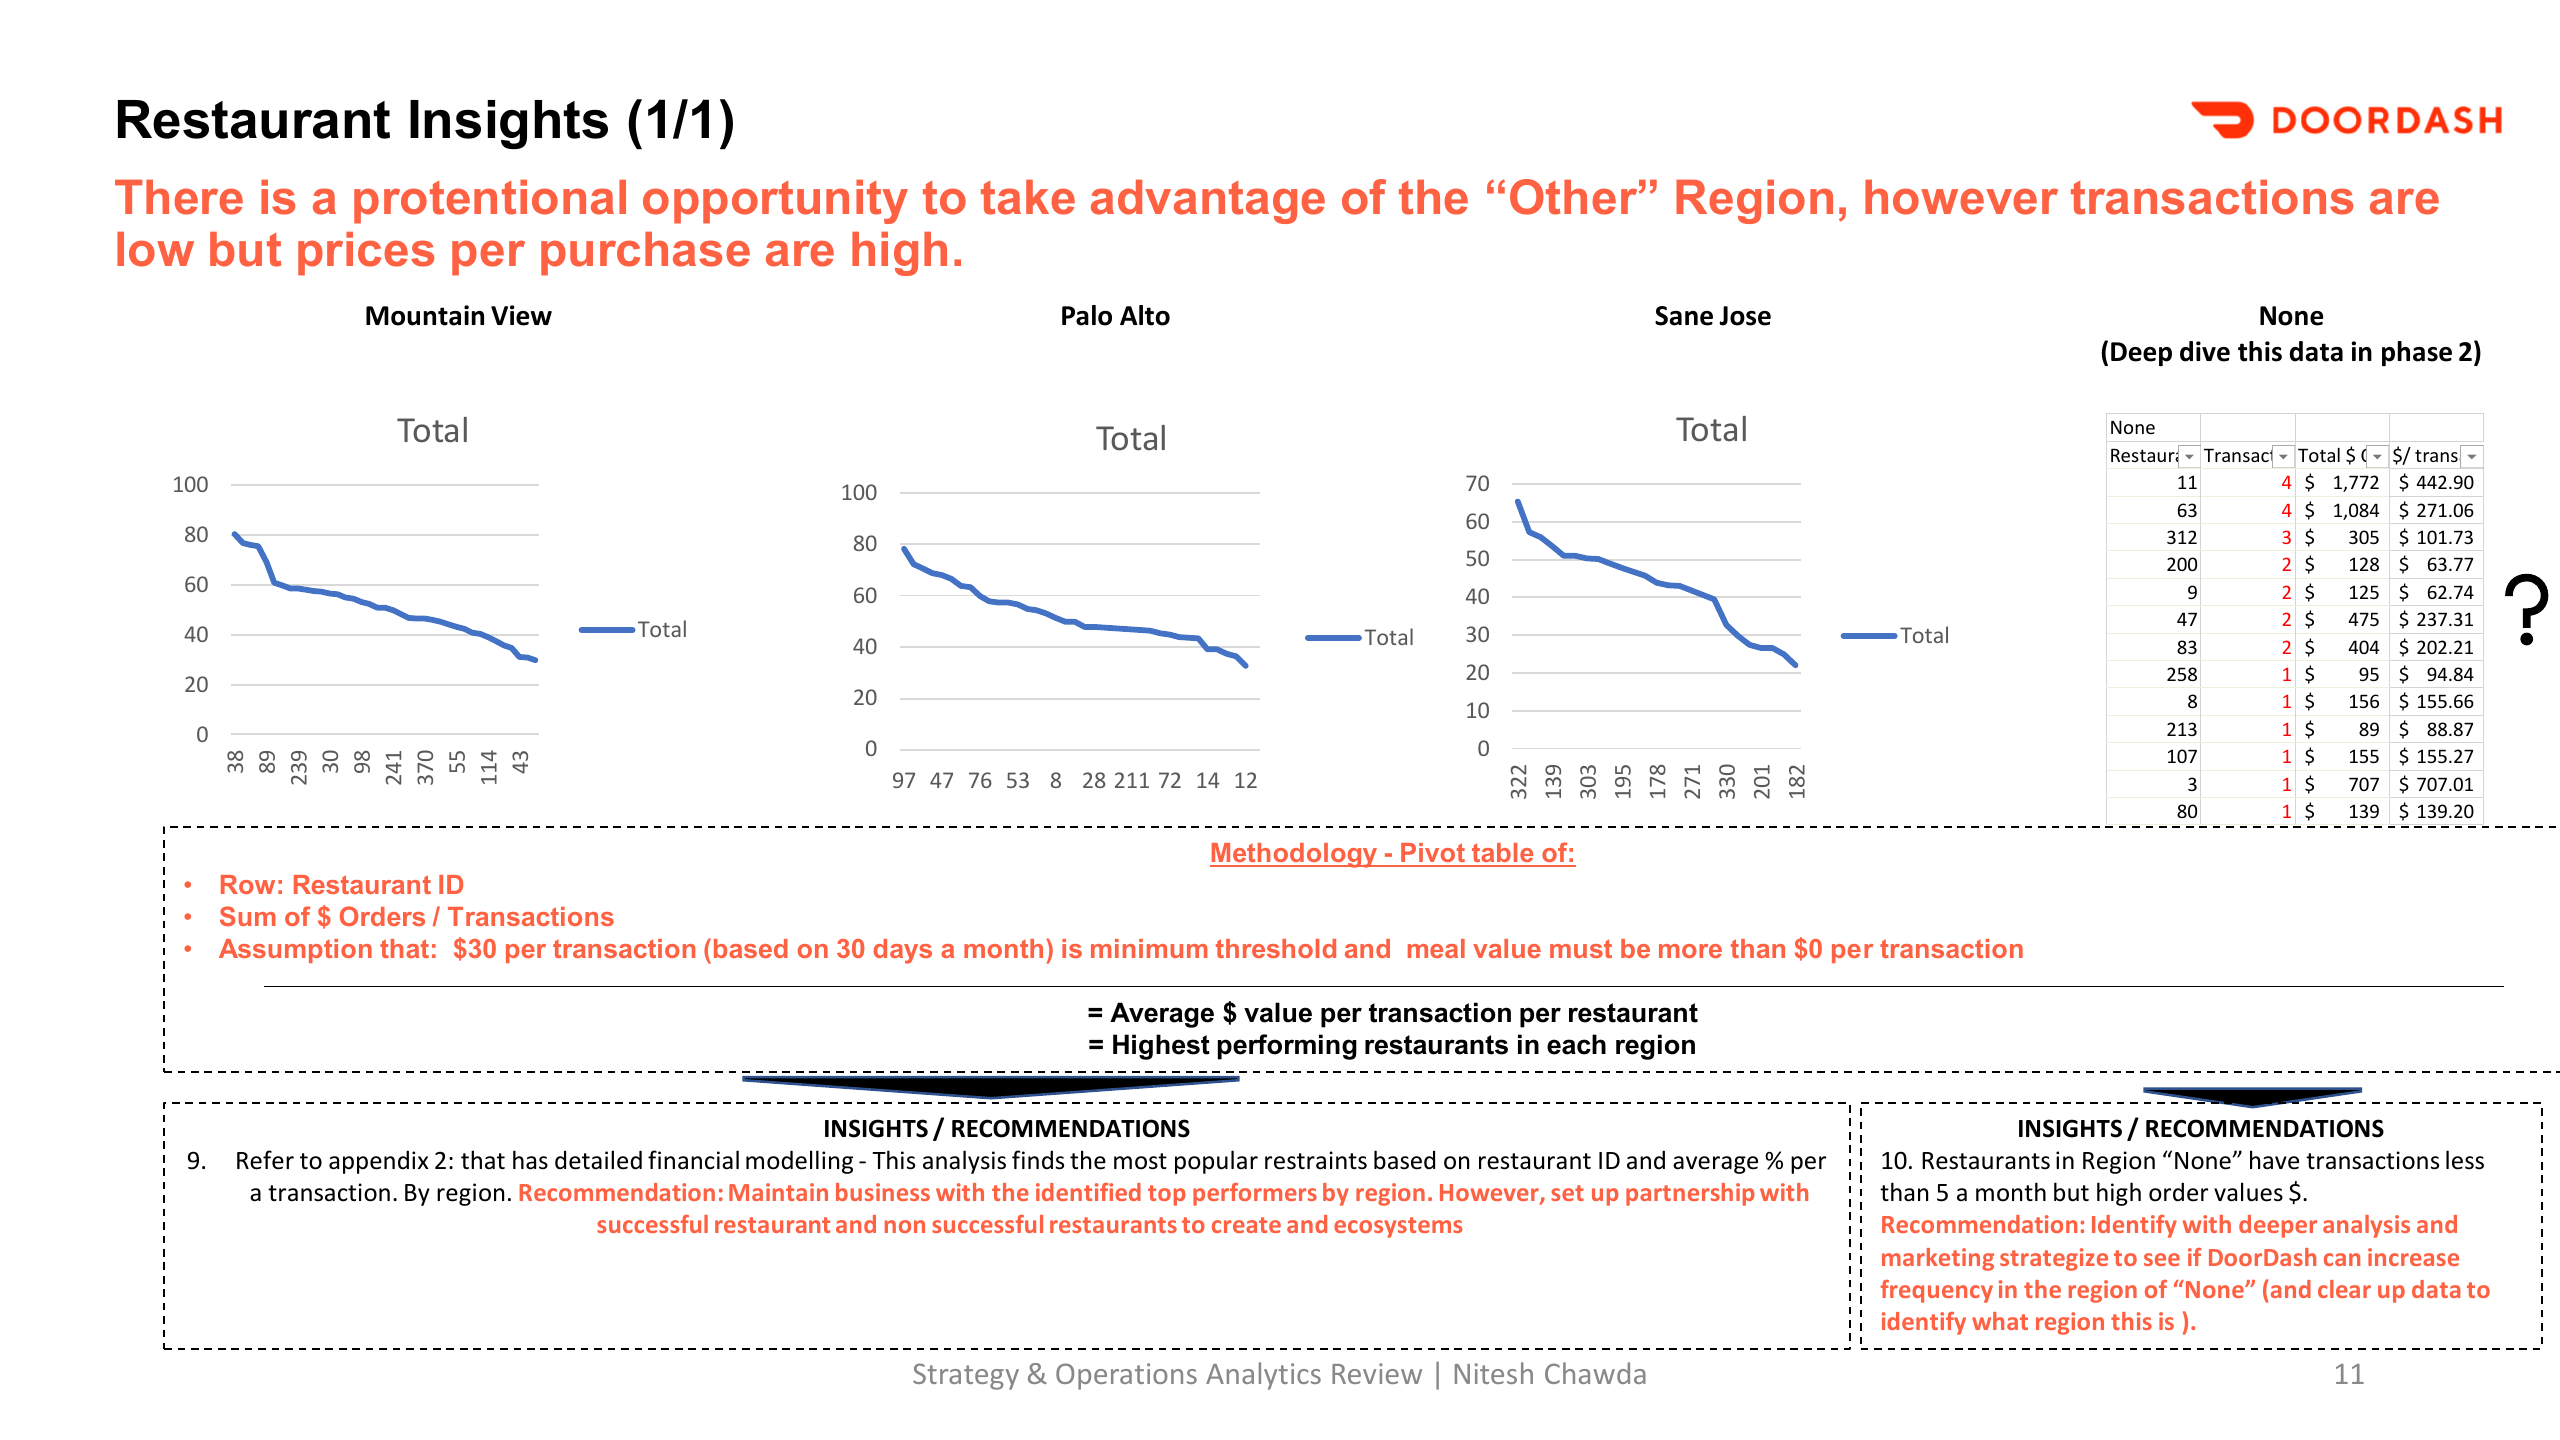
The restaurant analysis separated transaction value from frequency. High-value orders in an unassigned region were a reason to improve the data and investigate the opportunity before committing investment.
View original slides: Customers, demand and restaurants
03 / The answer: customer experience
Connect service issues to action.
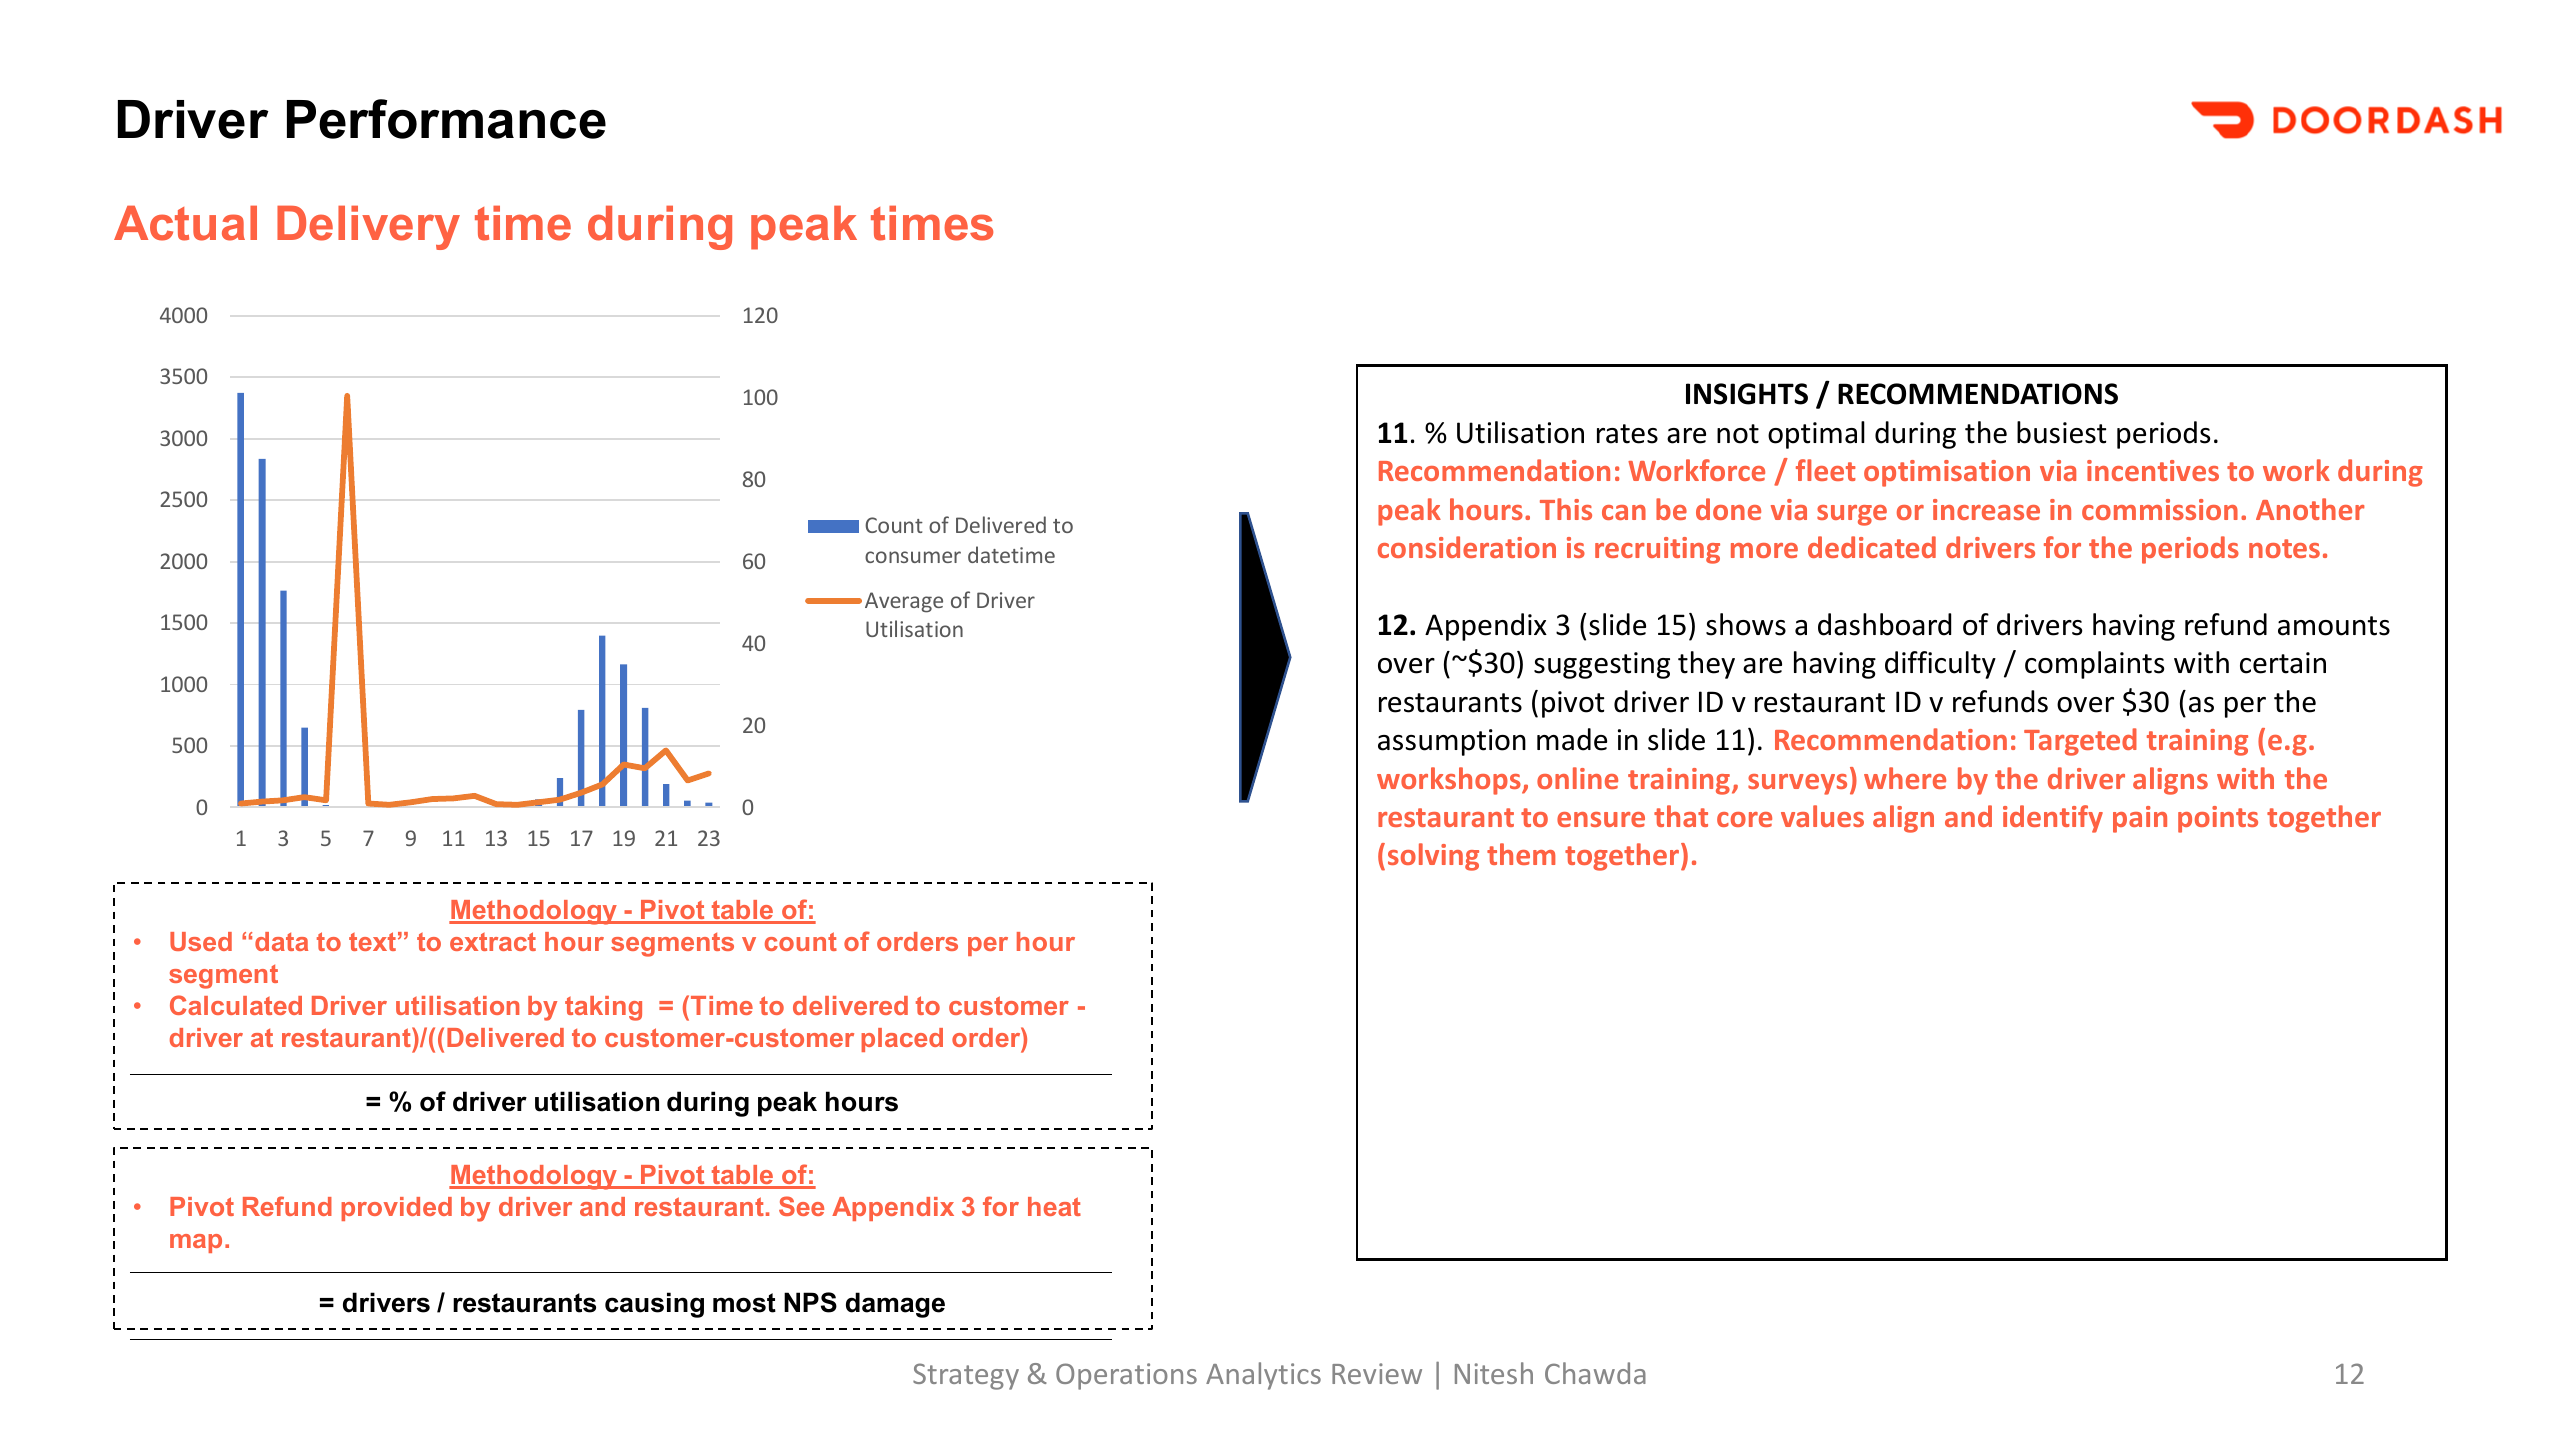
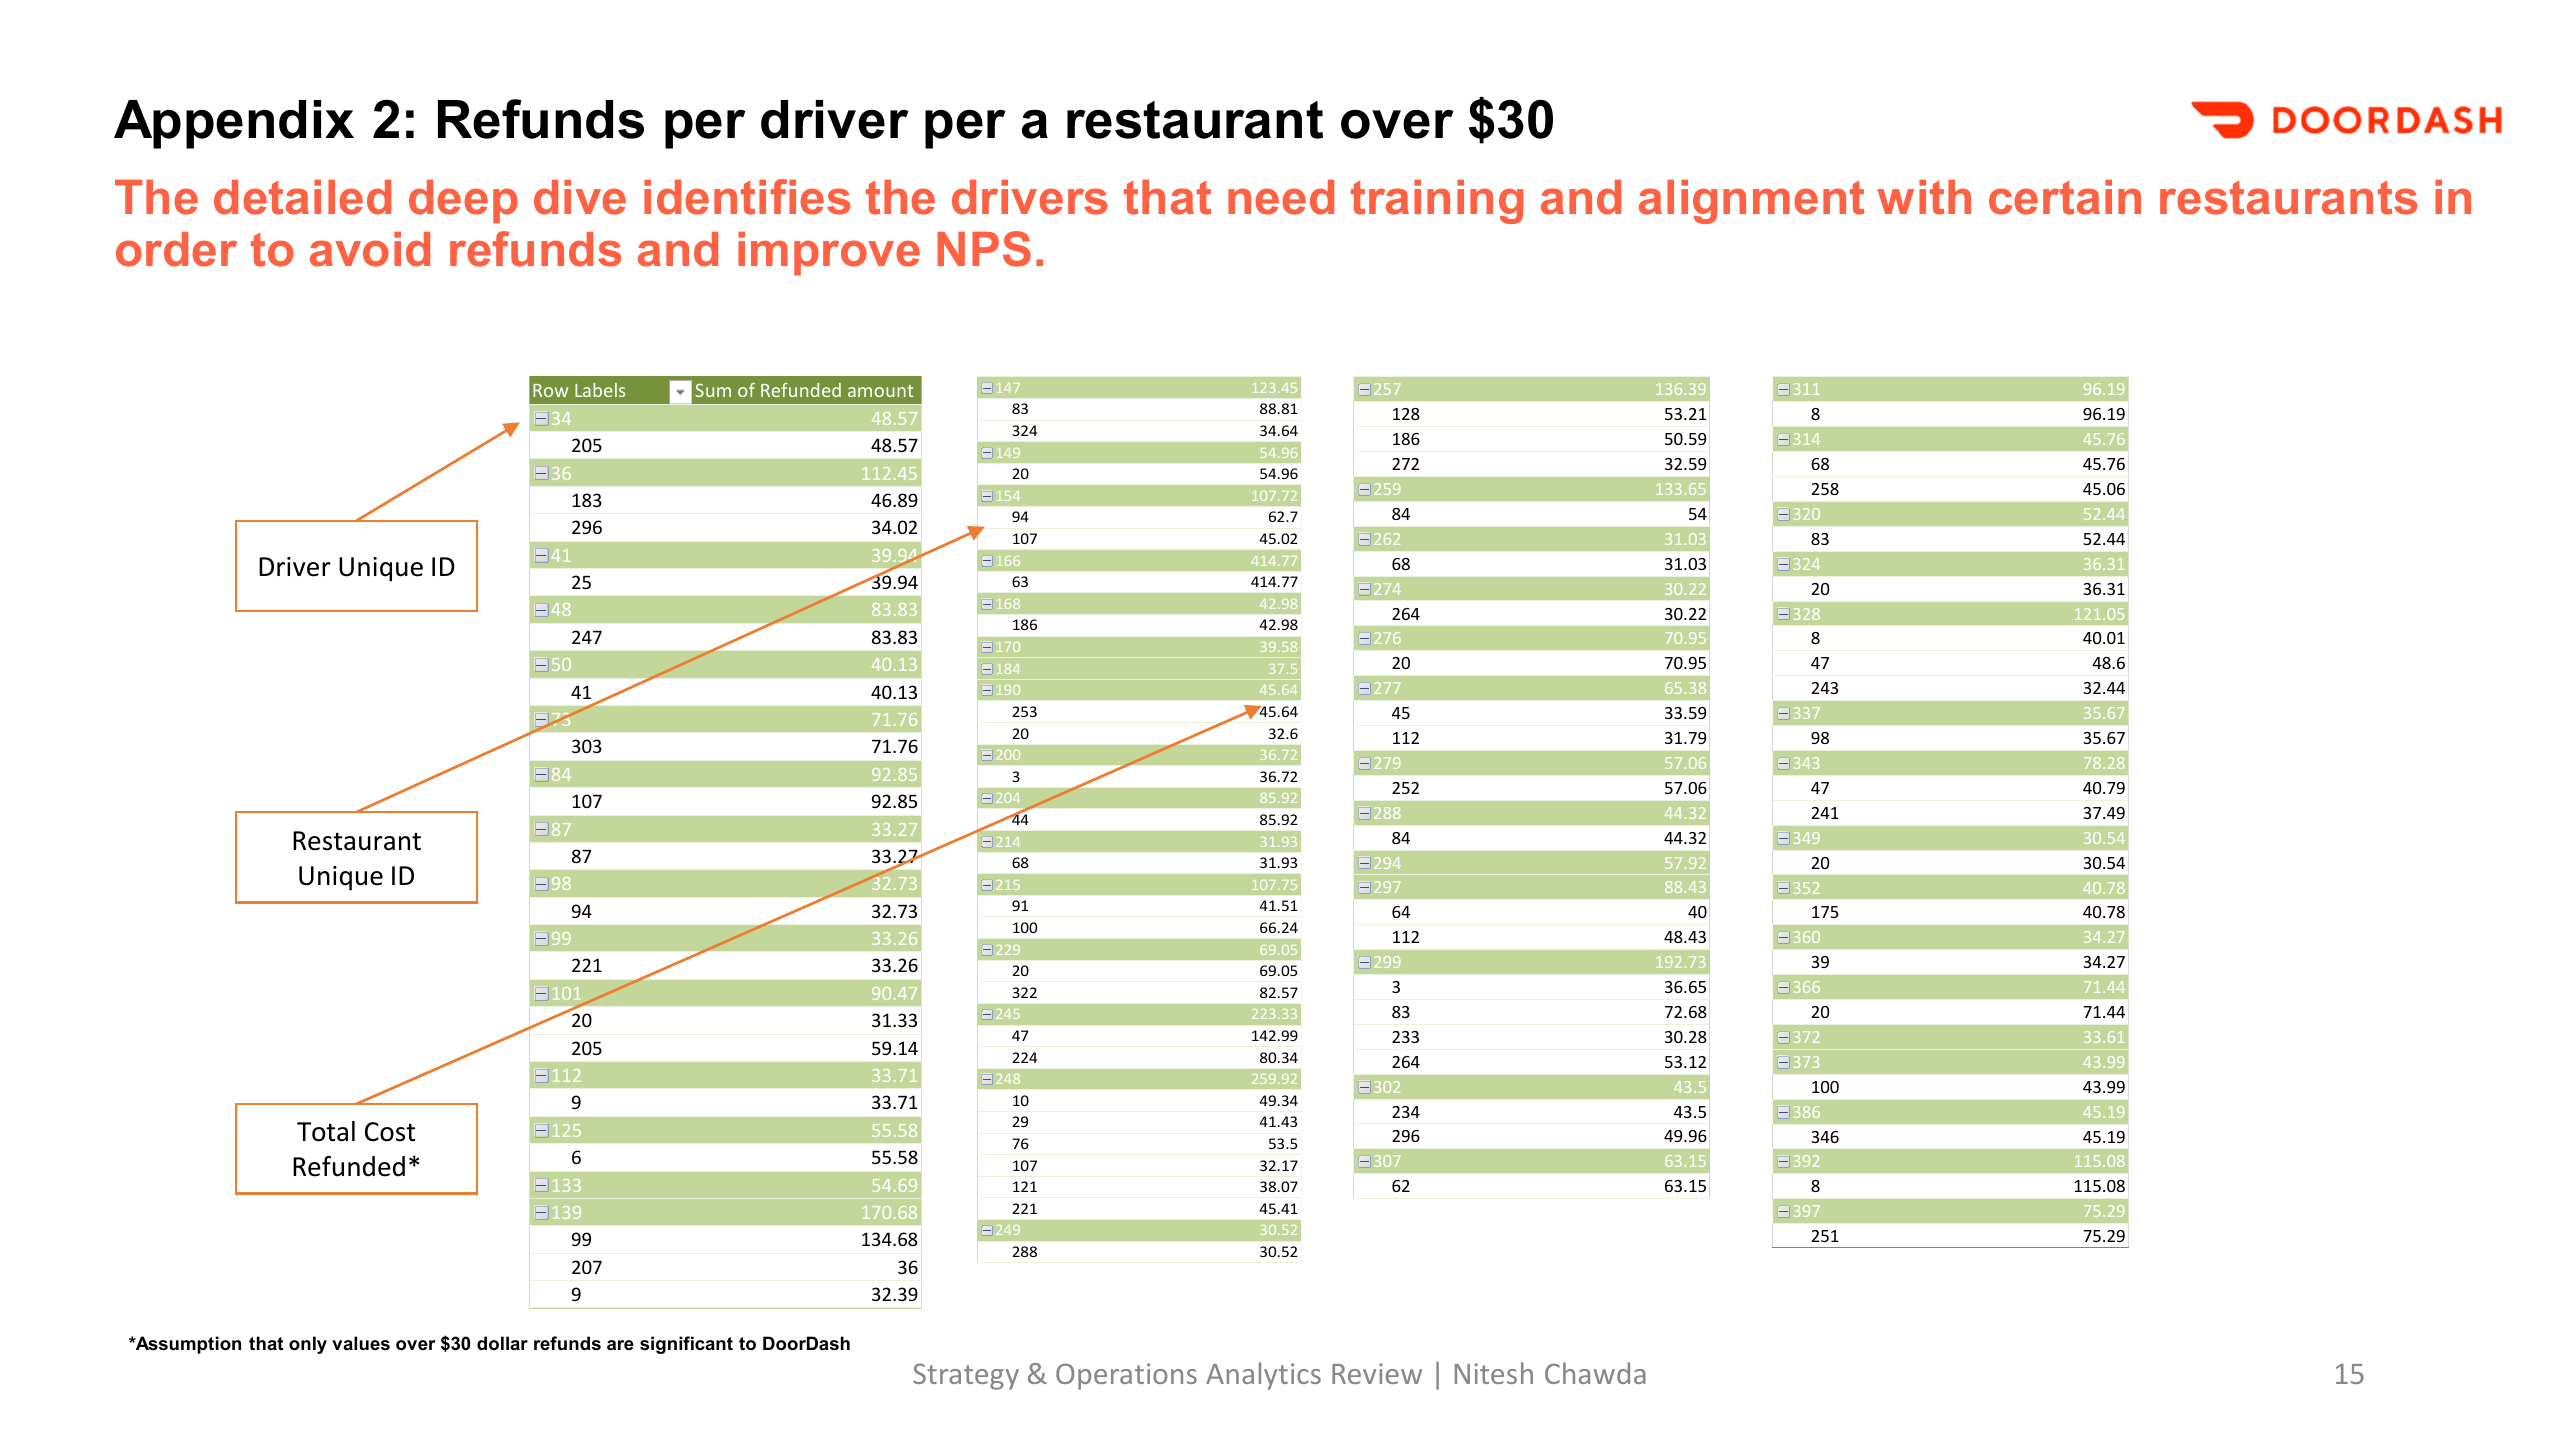
I compared delivery timing with demand and examined refunds by driver and restaurant. The recommendations linked peak-period coverage with incentives, and proposed joint training, workshops and surveys to understand and address recurring service problems.
Refunds were a signal for investigation. Improving customer experience and Net Promoter Score (NPS) was the objective; the analysis did not contain measured NPS scores or a before-and-after improvement.
View original slides: Delivery performance and refunds
04 / Where AI could take this next
From observed patterns to better decisions.
Today, I would extend this analytical foundation with AI-assisted forecasting and service insight. These are proposed next steps, building on the original analysis.
Plan capacity
Use a longer history of demand, location and timing to forecast order volumes and inform driver coverage.
Test relevance
Model repeat-order propensity and test targeted offers against a control group, tracking margin as well as sales.
Find recurring issues
With suitable complaint and survey data, classify service themes and connect them to refund patterns for human review.
Any pilot would require validated data, clear ownership and a baseline for order frequency, contribution margin, delivery reliability, refunds and directly measured customer feedback.
The corporate strategy underneath
Connect growth to the way the business works.
Business Design
Connect order value and repeat demand with delivery capacity and the cost of service failures.
Market Model
Examine customer frequency, regional differences and demand by hour to focus growth efforts.
Competitive Model
Strengthen the proposition through relevant offers, restaurant partnerships and a more reliable experience.
How this work connects to my eight steps
The completed work covers analysis and recommendations. The framework connects that evidence to the business case, pilots and delivery steps I would take next.
- 01 / EducateFrame sales and CX across consumers, restaurants and drivers.
- 02 / EnableOrganise the available data and define analytical measures.
- 03 / Big rocksIdentify repeat demand, peak coverage and refund patterns.
- 04 / Business caseNext: test incremental margin against offer and service costs.
- 05 / Scope & proveNext: pilot targeted offers and service interventions.
- 06 / BuildNext: implement validated actions with accountable owners.
- 07 / ExpandNext: extend successful pilots across suitable segments.
- 08 / ScaleNext: govern performance, customer feedback and AI use.
Contact